
Capturing Windows performance metrics via Performance Monitor
This page explains how to configure Performance Monitor (perfmon) to collect performance data from a Windows Server 2012 system. The steps described are also applicable, with minor variations, to other versions of the Microsoft Windows operating system.
Example scenario:
Authentication timeouts occur at random times during the day, and the cause is unclear. For instance, a time gap may appear in YSoft SafeQ log files during the affected period, suggesting possible server performance issues. The exact time of the issue is unpredictable, therefore continuous performance monitoring is required until the problem occurs.
To avoid disk space depletion, it is essential to configure capture limits (e.g. size or duration). Retaining data for too long (e.g. one month) is unnecessary if the issue occurred just a day ago. Additionally, enabling rolling captures at fixed intervals is recommended - smaller files covering shorter time spans (e.g. an hour) are easier to analyze than large multi-day logs.
Goals for the configuration:
capturing data in production hours from 8AM till 8PM
rolling performance data captures in hourly intervals
generating a basic graphical report per captured period
keeping maximally 10GB of data
archiving old report data after three days (to minimize the size) and deleting them after 7 days
Setting up the performance capture
Creating a collector set
Run perfmon.msc
Expand "Data Collector Sets" > right-click "User Defined" > New > Data collector set
Set the name (e.g. "Y Soft performance check") > select "Create from a template" > Next
Select "System Performance" > Next
Specify the path where the outputs shall be stored > Finish
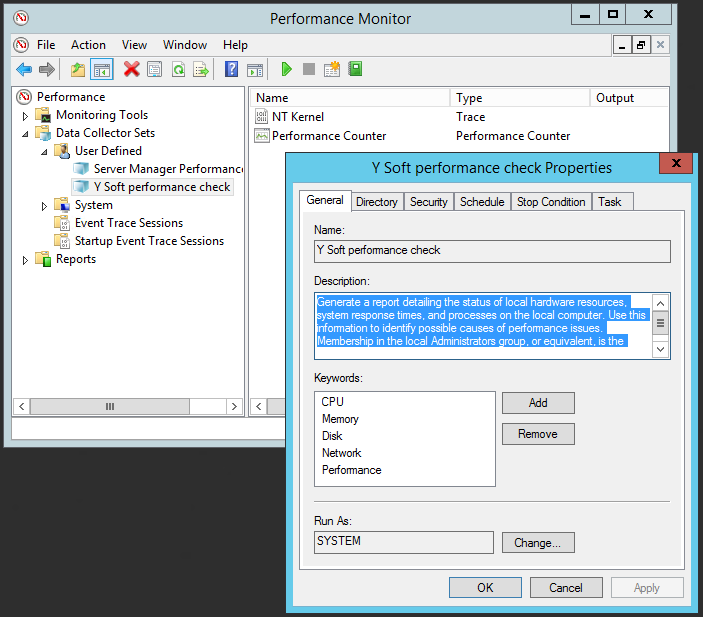
Setting up a collector set
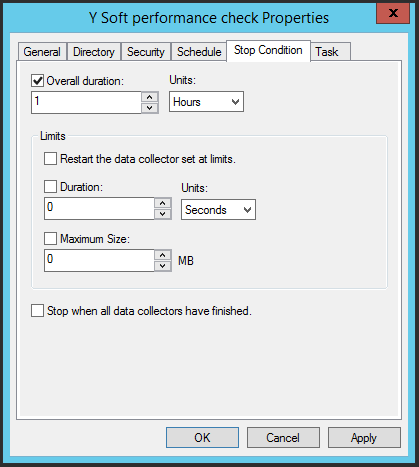
Right-click your collector set > Properties > Stop condition
Set Overall duration to 60 minutes and confirm it by pressing "OK"
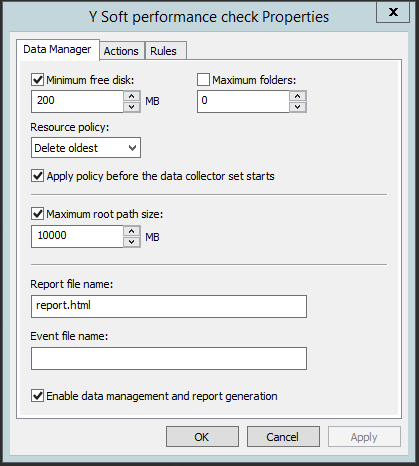
Right-click your collector set > "Data Manager"
un-tick checkbox "Maximum folders"
set "Resource policy" to "Delete oldest"
set "Maximum root path size" to 10000MB and confirm it by pressing "OK"
Setting up a scheduled task
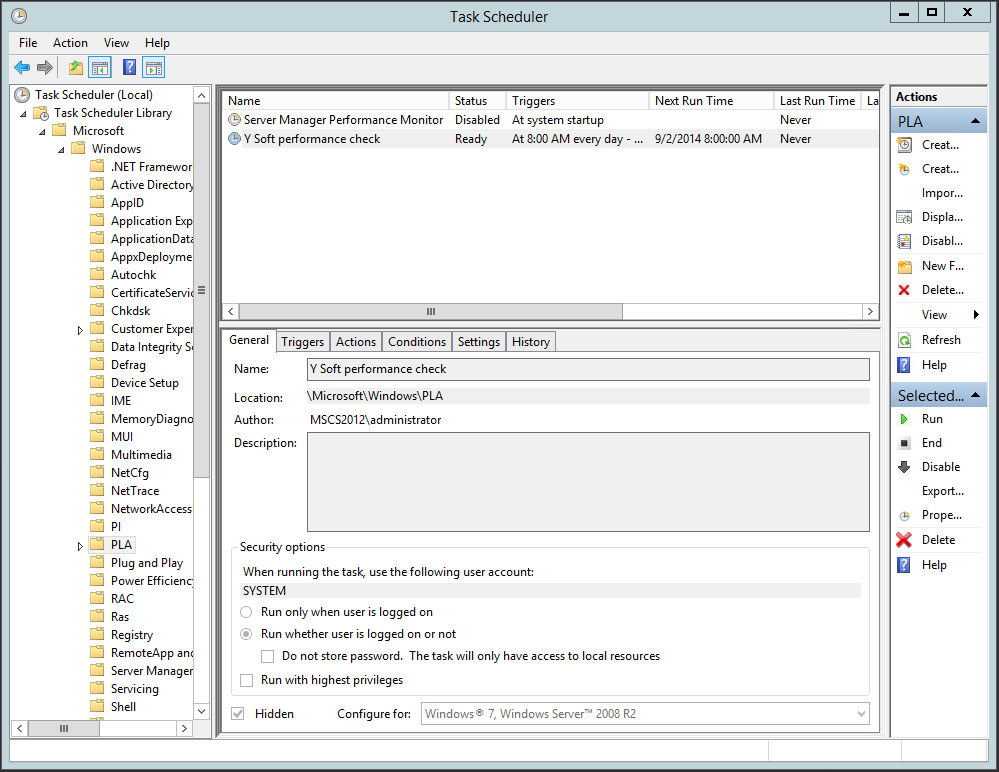
Run taskschd.msc
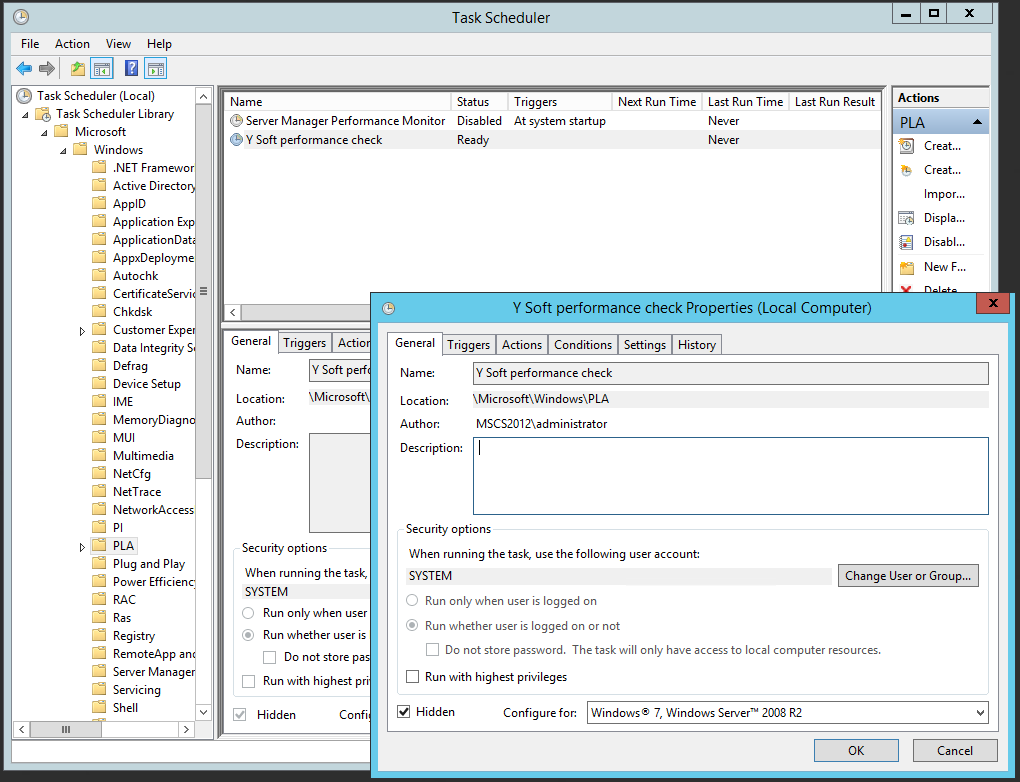
Browse to structure "Task Scheduler Library" > Microsoft > Windows > PLA
Double-click the scheduled task that has the same name as your collector set
Edit the schedule in a following way:
Triggers > New > Edit following settings and confirm by OK:
Daily, Start at current date from 8AM, reoccur every 1 days
Repeat task every 1 hour for a duration of 12 hours
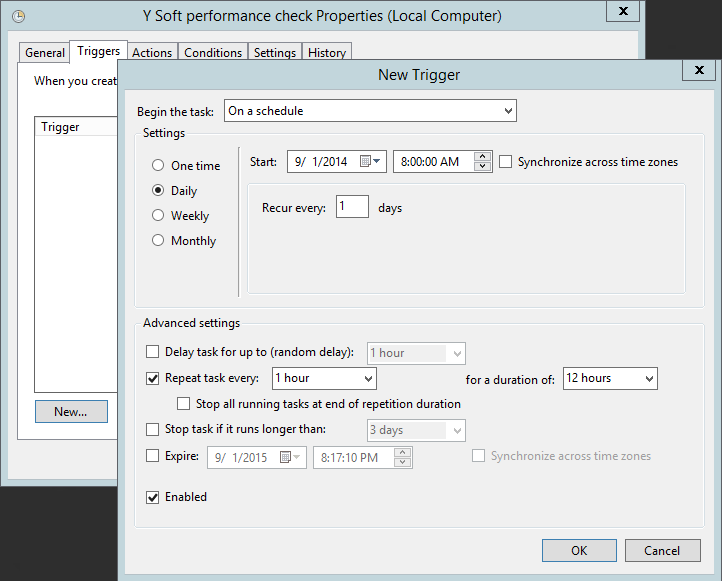
Settings
Queue the new instance
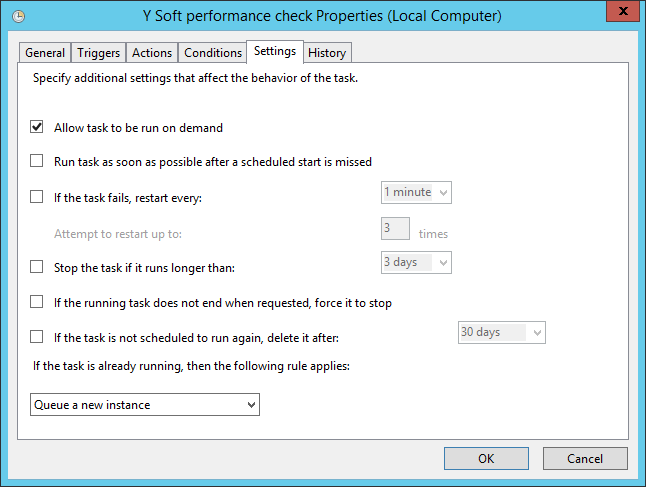
Confirm schedule by "OK"
Verify the "Next Run Time" is scheduled for the closest possible time that fits to your configuration and that Status is "Ready"
Test that scheduled task works
Right-click your scheduled task > Run
Task "Status" must switch to "Running"
Wait two minutes > Status must be still "Running"
Right-click your scheduled task > End > Yes
Task "Status" must switch to "Ready"
On Windows 10 and Windows 2019 the Scheduled task may stop by itself in a few seconds without generating any diagnostic data. In such a case follow:
https://docs.microsoft.com/en-us/troubleshoot/windows-server/performance/user-defined-dcs-doesnt-run-as-scheduled
Viewing the collected data
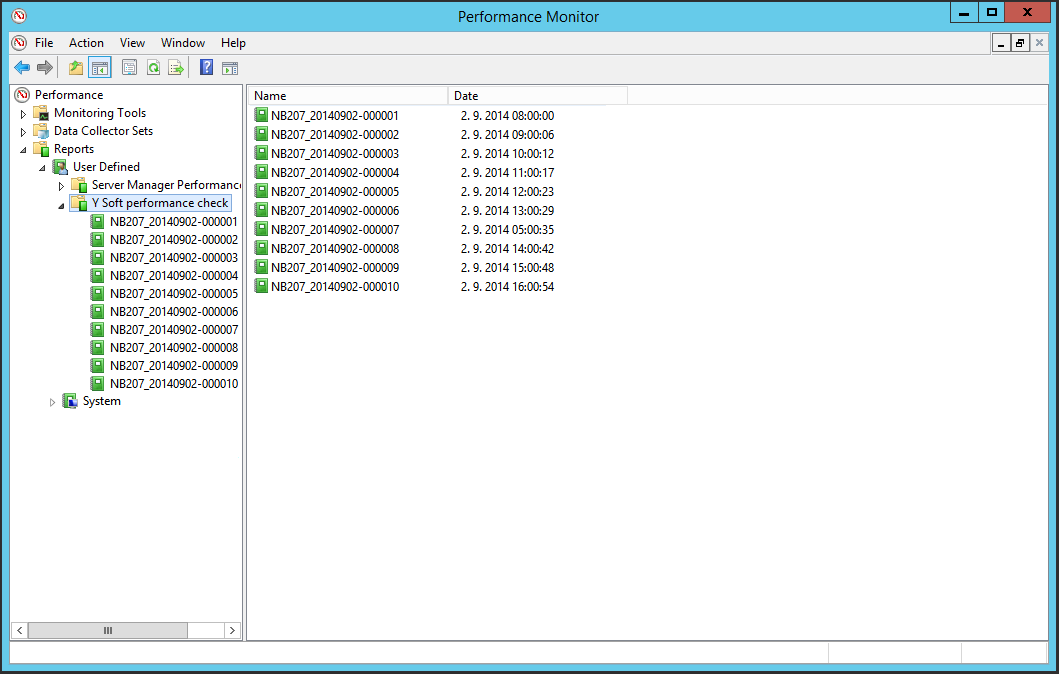
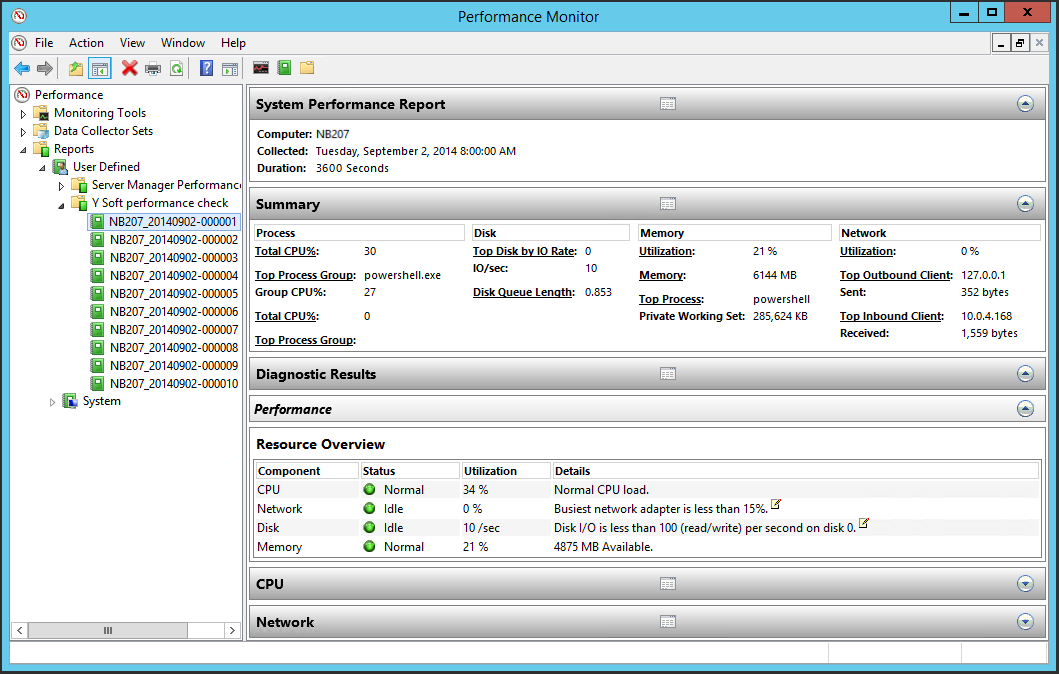
To see the collected data run perfmon.msc > Reports > User Defined > Expand the name of collector set you have defined.
Note: To understand in details to the outputs of perfmon, kindly see the documentation of your operating system or contact Microsoft technical support.
You can see captures from various collectors showing the exact time the collection has started.
You can right-click any output on the left side > select "View" > "Report" and see the report the pefmon has already generated for you. The "Summary" and "Diagnostic Result" may show you general performance over the evaluated period. To display detailed data simply open a relevant category (e.g. Disk > Physical disk > see "Avg. Disk sec/Transfer").
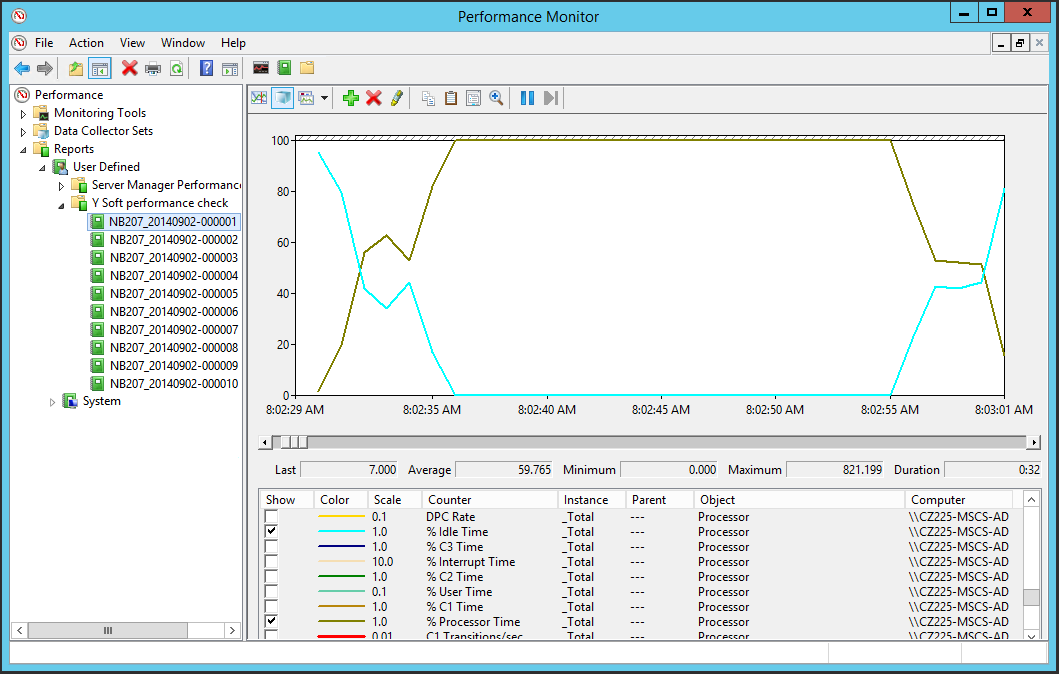
You can right-click any output on the left side > select "View" > "Performance Monitor" to see the detailed performance data. Zooming in and selecting appropriate time frame may around the time of occurrence may reveal important information (such as high CPU usage).
You can right-click any output on the left side > select "View" > "Folder" to view the capture data. These data can be collected and shared with your colleagues or Y Soft customer support services when requested.